Troy's Scratchpad

May 22, 2012

First Pass at Insolation-Weighted Sea Ice Area

Filed under: Uncategorized — troyca @ 7:07 pm

I’ve been curious about an insolation-weighted sea ice index for a while now, as this would have the potential to highlight what is most relevant from an albedo-feedback perspective (such as location and time of year of the sea ice area).  In fact, my primary interest was what this would reveal with respect to the importance of Northern vs. Southern hemisphere sea ice trends.  Recently, Dr. Pielke even pointed to a paper of his doing an insolation-weighted analysis, although I would also like to include a combined NH+SH global index as well. 

Anyhow, having never worked with the NCIDC sea ice data before, Jeff Id’s code was helpful in greatly reducing the learning curve.  I decided only to use monthly data (rather than daily) from NSIDC, which you can get from here (you may need to register first). Code and the other data is available here, although you’ll need to download the North and South ice area files first from the location I have given and put them into respective folders "North" and "South" within the working directory specified atop the script.

My method is fairly simple: determine the average TOA insolation for each latitude band (1 degree width) each month (Jan, Feb, etc.) from the four year average (2001-2004) according to CERES SSF1 degree dataset (which I believe in turn gets its incident solar radiation from SORCE). Since we have the latitude for each sea ice area grid point, we can multiply that area fraction by the solar insolation at that latitude for the month.  In terms of quality control, I have done very little (although I’m using the "final" rather than "preliminary" NSIDC dataset).  First, due to the transition from n07 to f08, the different satellite trajectories led to fewer orbit-induced missing points above the Arctic (from 1799 to 468), so these these points must be kept masked throughout the entire period to avoid a spurious jump.  Second, there is a "major data gap in the SSM/I data" for the SH, leaving only 2 days in December 1987 and creating an obvious outlier, so I’ve excluded that single month.  Other than that it’s pretty straightforward in this first pass.

Obviously, to compare the insolation-weighted metric to the raw values on the same graph we’ll want to use the percent change anomaly.  Anyhow, here are the results:
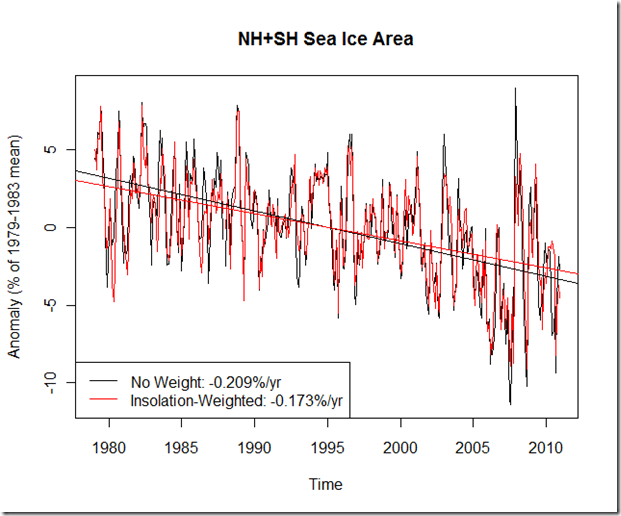
NorthernHemisphere

SouthernHemisphere


Combined
               
 
So what is interesting at this juncture?  Well, the insolation-weighted metric slightly increases the decline rate in the NH relative to the raw values, while slightly decreasing the incline rate in the SH.  At first thought, this would seem to imply that the combined NH+SH insolation-weighted metric would show a steeper decline than the raw metric.  However, this is not the case – presumably because the bulk of the sea ice in the SH is further from the pole than NH sea ice, and therefore receives more insolation.  This result is at least qualitatively consistent with Hall (2004) , where sea ice is expected to play a larger role in the SH. 

That said, I consider this a first pass because it does not take into account clouds, uses TOA solar insolation rather than surface  and uses a single monthly average (not broken up by time of day) for insolation, all of which may be an oversimplification.  There are methods that I’m pursuing which may better translate directly into the effect of sea ice changes on global albedo.

May 8, 2012

Northern and Southern Hemisphere Warming in Models and GISTEMP

Filed under: Uncategorized — troyca @ 8:31 am

Since I’ve already done the work for this and posted it in a comment at Dr. Held’s blog post, I decided it would be appropriate to post a bit on it here as well (at the very least to supply the data and code). 

The basic subject of that post (at least my takeaway) was figuring out what the spatial structure of recent warming (in particular, Northern Hemisphere vs. Southern Hemisphere from 1980-2010) can tell us about the transient climate response (TCR).  This is something I’d been curious myself about as well, although more with respect to forcing histories: if aerosols were playing a large role in suppressing the overall warming, then I would have expected this suppression to occur primarily in the NH (due to the regional nature of the aerosols), and therefore the SH would experience more warming relative to the NH (although it is complicated by the greater land mass in the North).  But what we see is the opposite: a NH trend that is far higher than the SH trend (about 3.3 times according to GISTEMP). My original thought was that the NH/SH ratio would be correlated with the aerosol forcing across the models, and that I might be able to use that to estimate the actual aerosol forcing we’ve experienced.  However, that is an investigation for a future time, as this forcing data is not easily available at Climate Explorer and I’ll need to perform some bulk downloads from PCMDI.  Instead, based on Dr. Held’s prompt, I downloaded the NH and SH average temperatures for the CMIP3 models from Climate Explorer in an effort to compare the ratio directly to the published TCRs of the models.

First, here’s a comparison of the NH and SH warming in GISS to the CMIP3 multi-model-mean:

 NorthVsSouthernWarming 

The NH trend for MMM is very close to that of GISS (0.24 K/decade compared 0.25 K/decade), but the MMM overestimates the SH trend by a factor of 2.5 (0.17 K/decade compared to 0.07 K/decade).  Still, in general the models show a slightly larger NH than SH trend, which is at least qualitatively consistent with what we see in GISTEMP.   

Now, here are the actual results for the NH/SH ratio (along with the overall warming trend).  The TCR is from AR4 WG1 table 8.2.  I’ve included the min and max values of the NH/SH ratio for those models with multiple runs in order to get some idea of the spread:

 5-5-12_CMIP3_WarmingImbalance

It appears that no models (or even any model runs) seem to capture this differential warming.  But what does this tell us about the TCR?

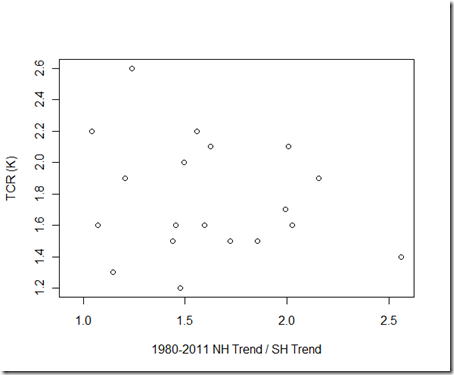
At first glance, there doesn’t seem to be much of a relationship between TCR and this NH/SH ratio (recall, we expect a negative one):

TCRvsTrendRatio

Of course, we wouldn’t expect much of a relationship if we didn’t take into account the TCR vs. overall warming trend as well, which does show something of a relationship:

TCRvsOverallTrend

I ran a multiple regression of TCR against the two variables (NH/SH ratio and overall warming trend).  This at least gives us what we qualitatively expect for TCR – a positive coefficient for overall trend, versus a negative coefficient for  NH/SH warming ratio.  Plugging in the values from GISSTEMP directly into the resulting coefficients indicate a TCR of around 1.4K.  However, the relationship is nowhere near significant, particularly given the high degrees of freedom with only a few (18?) models with TCR available.  Thus, the spread of "uncertainty" in that estimate for TCR is so large as to basically be worthless.  Some better method of combining these values would be needed, or additional data to help constrain the estimate.  Perhaps knowing which of the models include volcanic forcings would help.  Or, maybe the differential warming will simply be a better predictor of the aerosol forcings, which could then be used to constrain TCR (or ECS for that matter).   

Create a free website or blog at WordPress.com.