I saw a post over at Roger Pielke Sr.’s a few days ago with some preliminary analysis of the sea surface trends by latitude, the primary point of which seemed to be that the water vapor feedback may be overestimated, as the warmer waters in the topics – which contribute more to evaporation – were actually heating at a slower rate than other regions. I was skeptical of a few aspects of this, particularly the analysis with the short period (2003-2011) and the fact that a the width of the latitude bands showing the trends seemed to arbitrary. Furthermore, what it showed was a general increase in temperature trend the further North it went over the period 1982-2011, which I seemed to recall was similar in the GFDL CM2.1 model run.
Thus, I decided to compare the monthly NOAA SST anomaly trends by latitude to several of the GFDL CM2.1 model run trends by latitude over the same period (1982-2010 was the overlap here). I used those GFDL CM2.1 runs for CMIP5 (rather than the CMIP3 runs I had used before), so these should have used historical forcings up until 2005. I ultimately downloaded 5 of the 10 runs to get a decent sense of variability over that period. Intermediate data and code for this post is available here…you’ll see that I used 15 degree latitude bands to cut down on some of the noise.
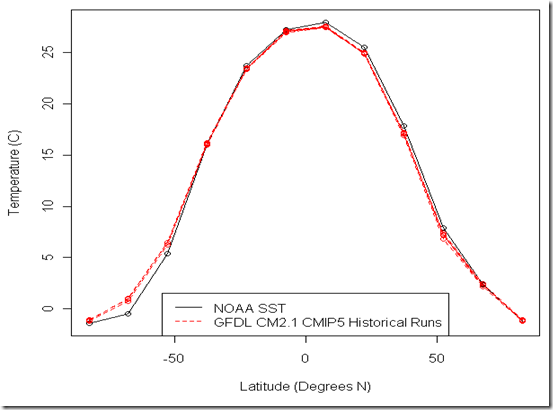
Anyhow, when it came to reproducing the absolute temperatures by latitude, GFDL CM2.1 did quite well, although perhaps this was to be expected:
However, I was somewhat surprised to see that the spatial pattern of the warming was quite different:
While the model seems to overestimate the SST trends, this was perhaps common knowledge already. Instead, what is more interesting is that despite the variability in the model runs, almost all of them seem to show the greatest rate of warming near the equator, thus producing the general shape we see in the blue line (the mean from the 5 runs). Compare it to the NOAA SST, and there appears to be a discrepancy.
So, what affect will this have on the TOA radiation and the water vapor feedback? I’m not sure. My next step, if I find time, will be to compare a GFDL CMIP5 AMIP run (which has the atmospheric component tied to the actual SST observations up till 2008) to that of these coupled runs, perhaps using the GFDL water vapor kernels to convert the atmospheric specific humidity outputs in each into the global TOA radiative effect. Or perhaps this work is already out there, and I need to search the existing publications.

